Leiden Clustering for Drug Association Networks
Implementing weighted KNN and Leiden clustering in Go with an R Shiny Dashboard
Group Members:
- Jeff Winchell
- Ajay Prabhakar
- Nethan Ramachandran
Project Overview
This project implements an end-to-end pipeline for constructing and analyzing drug association networks (DANs) from high-dimensional transcriptional response data. Using perturbational gene expression signatures from the LINCS L1000 dataset, we model similarities between drug–cell line experiments as weighted graphs and apply the Leiden community detection algorithm to identify coherent groups of drugs with shared transcriptional and mechanistic effects.
The primary goals of this project are:
- To implement Weighted K-Nearest Neighbor (KNN) graph construction and Leiden clustering from scratch in Go.
- To evaluate the stability, modularity, and interpretability of the resulting communities.
- To assess whether data-driven communities recapitulate known pharmacological structure (e.g., MoA, ATC classes) while revealing finer-grained heterogeneity.
Data
- Dataset: LINCS L1000 (Level 5 signatures)
- Cell line: MCF7
- Nodes: Individual drug–cell line perturbation signatures
- Features: Differential gene expression profiles (landmark + inferred genes)
- Similarity metric: Cosine similarity
Graph Construction
For each perturbation signature, a weighted KNN graph is constructed by identifying the k most similar signatures in expression space. Edge weights encode transcriptional similarity, resulting in a sparse, weighted graph suitable for large-scale community detection.
Key design choices:
- Explicit control over sparsity via k
- CSR-based graph representation for memory efficiency
- Parallelized KNN construction for scalability
[Figure Placeholder]
Schematic of weighted KNN graph construction from transcriptional profiles
<!-- Insert figure: KNN_graph_construction.png -->
Community Detection (Leiden Algorithm)
We apply the Leiden algorithm to the weighted KNN graph using a resolution parameter γ to control community granularity. Leiden was chosen over Louvain due to its guarantees of well-connected communities and improved convergence properties.
Implementation highlights:
- Custom Go implementation of Leiden
- Support for modularity-based and resolution-parameterized quality functions
- Multi-level refinement and aggregation
- Grid search over (k, γ) to assess robustness
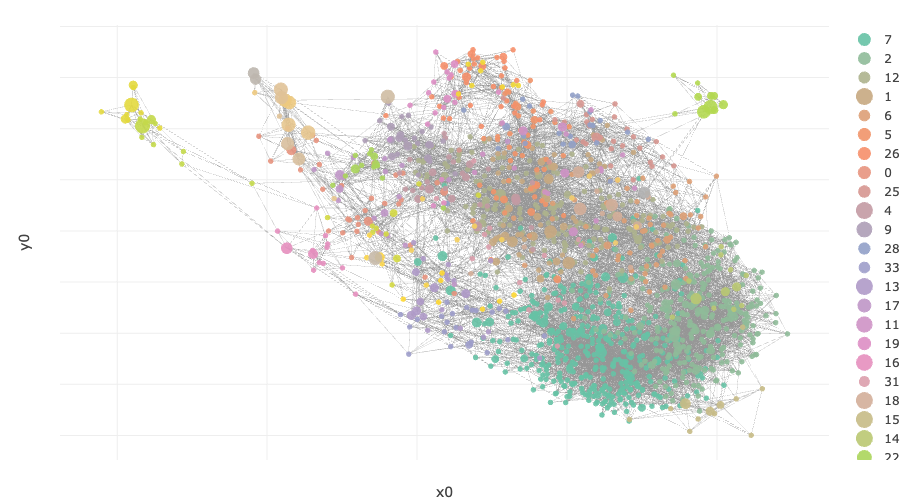
[Figure Placeholder]
Leiden clustering workflow and multi-level optimization
image
Hyperparameter Sensitivity and Stability
We systematically explored the effects of:
- KNN size (k)
- Resolution parameter (γ)
Community structure was evaluated using:
- Modularity
- Community size distributions
- Stability across parameter sweeps
This analysis highlights the importance of principled hyperparameter selection rather than reliance on defaults.
[Figure Placeholder]
Modularity vs. resolution parameter across KNN sizes
<!-- Insert figure: modularity_gridsearch.png -->
Biological Interpretation
To interpret the resulting communities, we integrated external annotations including:
- Mechanism of Action (MoA)
- ATC classifications
- Transcriptional Activity Score (TAS)
Key findings include:
- High-TAS perturbations preferentially form smaller, well-separated “satellite” communities
- Leiden communities align with known pharmacological classes
- Broad ATC categories are often subdivided into mechanistically distinct subcommunities
[Figure Placeholder]
UMAP visualization of signatures colored by Leiden community
<!-- Insert figure: umap_leiden.png -->
[Figure Placeholder]
TAS distribution across communities
<!-- Insert figure: tas_vs_community.png -->
Visualization and Exploration
An interactive RShiny dashboard was developed to explore:
- Community structure
- MoA and ATC enrichment
- TAS vs. community size
- Low-dimensional embeddings (UMAP)
This enables rapid qualitative inspection alongside quantitative analysis.
[Figure Placeholder]
Screenshot of RShiny dashboard
<!-- Insert figure: shiny_dashboard.png -->
Key Takeaways
- Leiden clustering yields robust and interpretable community structure in drug association networks.
- Transcriptional activity magnitude strongly shapes network topology.
- Mechanistic similarity is preserved even among drugs with moderate perturbation strength.
- Custom, low-level implementations enable fine-grained control and scalability for large biological graphs.
Future Directions
- Extend analysis to additional cell lines
- Compare Leiden with alternative quality functions (e.g., CPM)
- Integrate multi-modal data (e.g., cell painting, proteomics)
- Explore representation learning prior to graph construction
Code and Reproducibility
- Core graph construction and Leiden implementation written in Go
- Analysis and visualization in R (tidyverse, igraph, Shiny)
- Modular pipeline designed for reproducibility and extensibility
Repository: link here